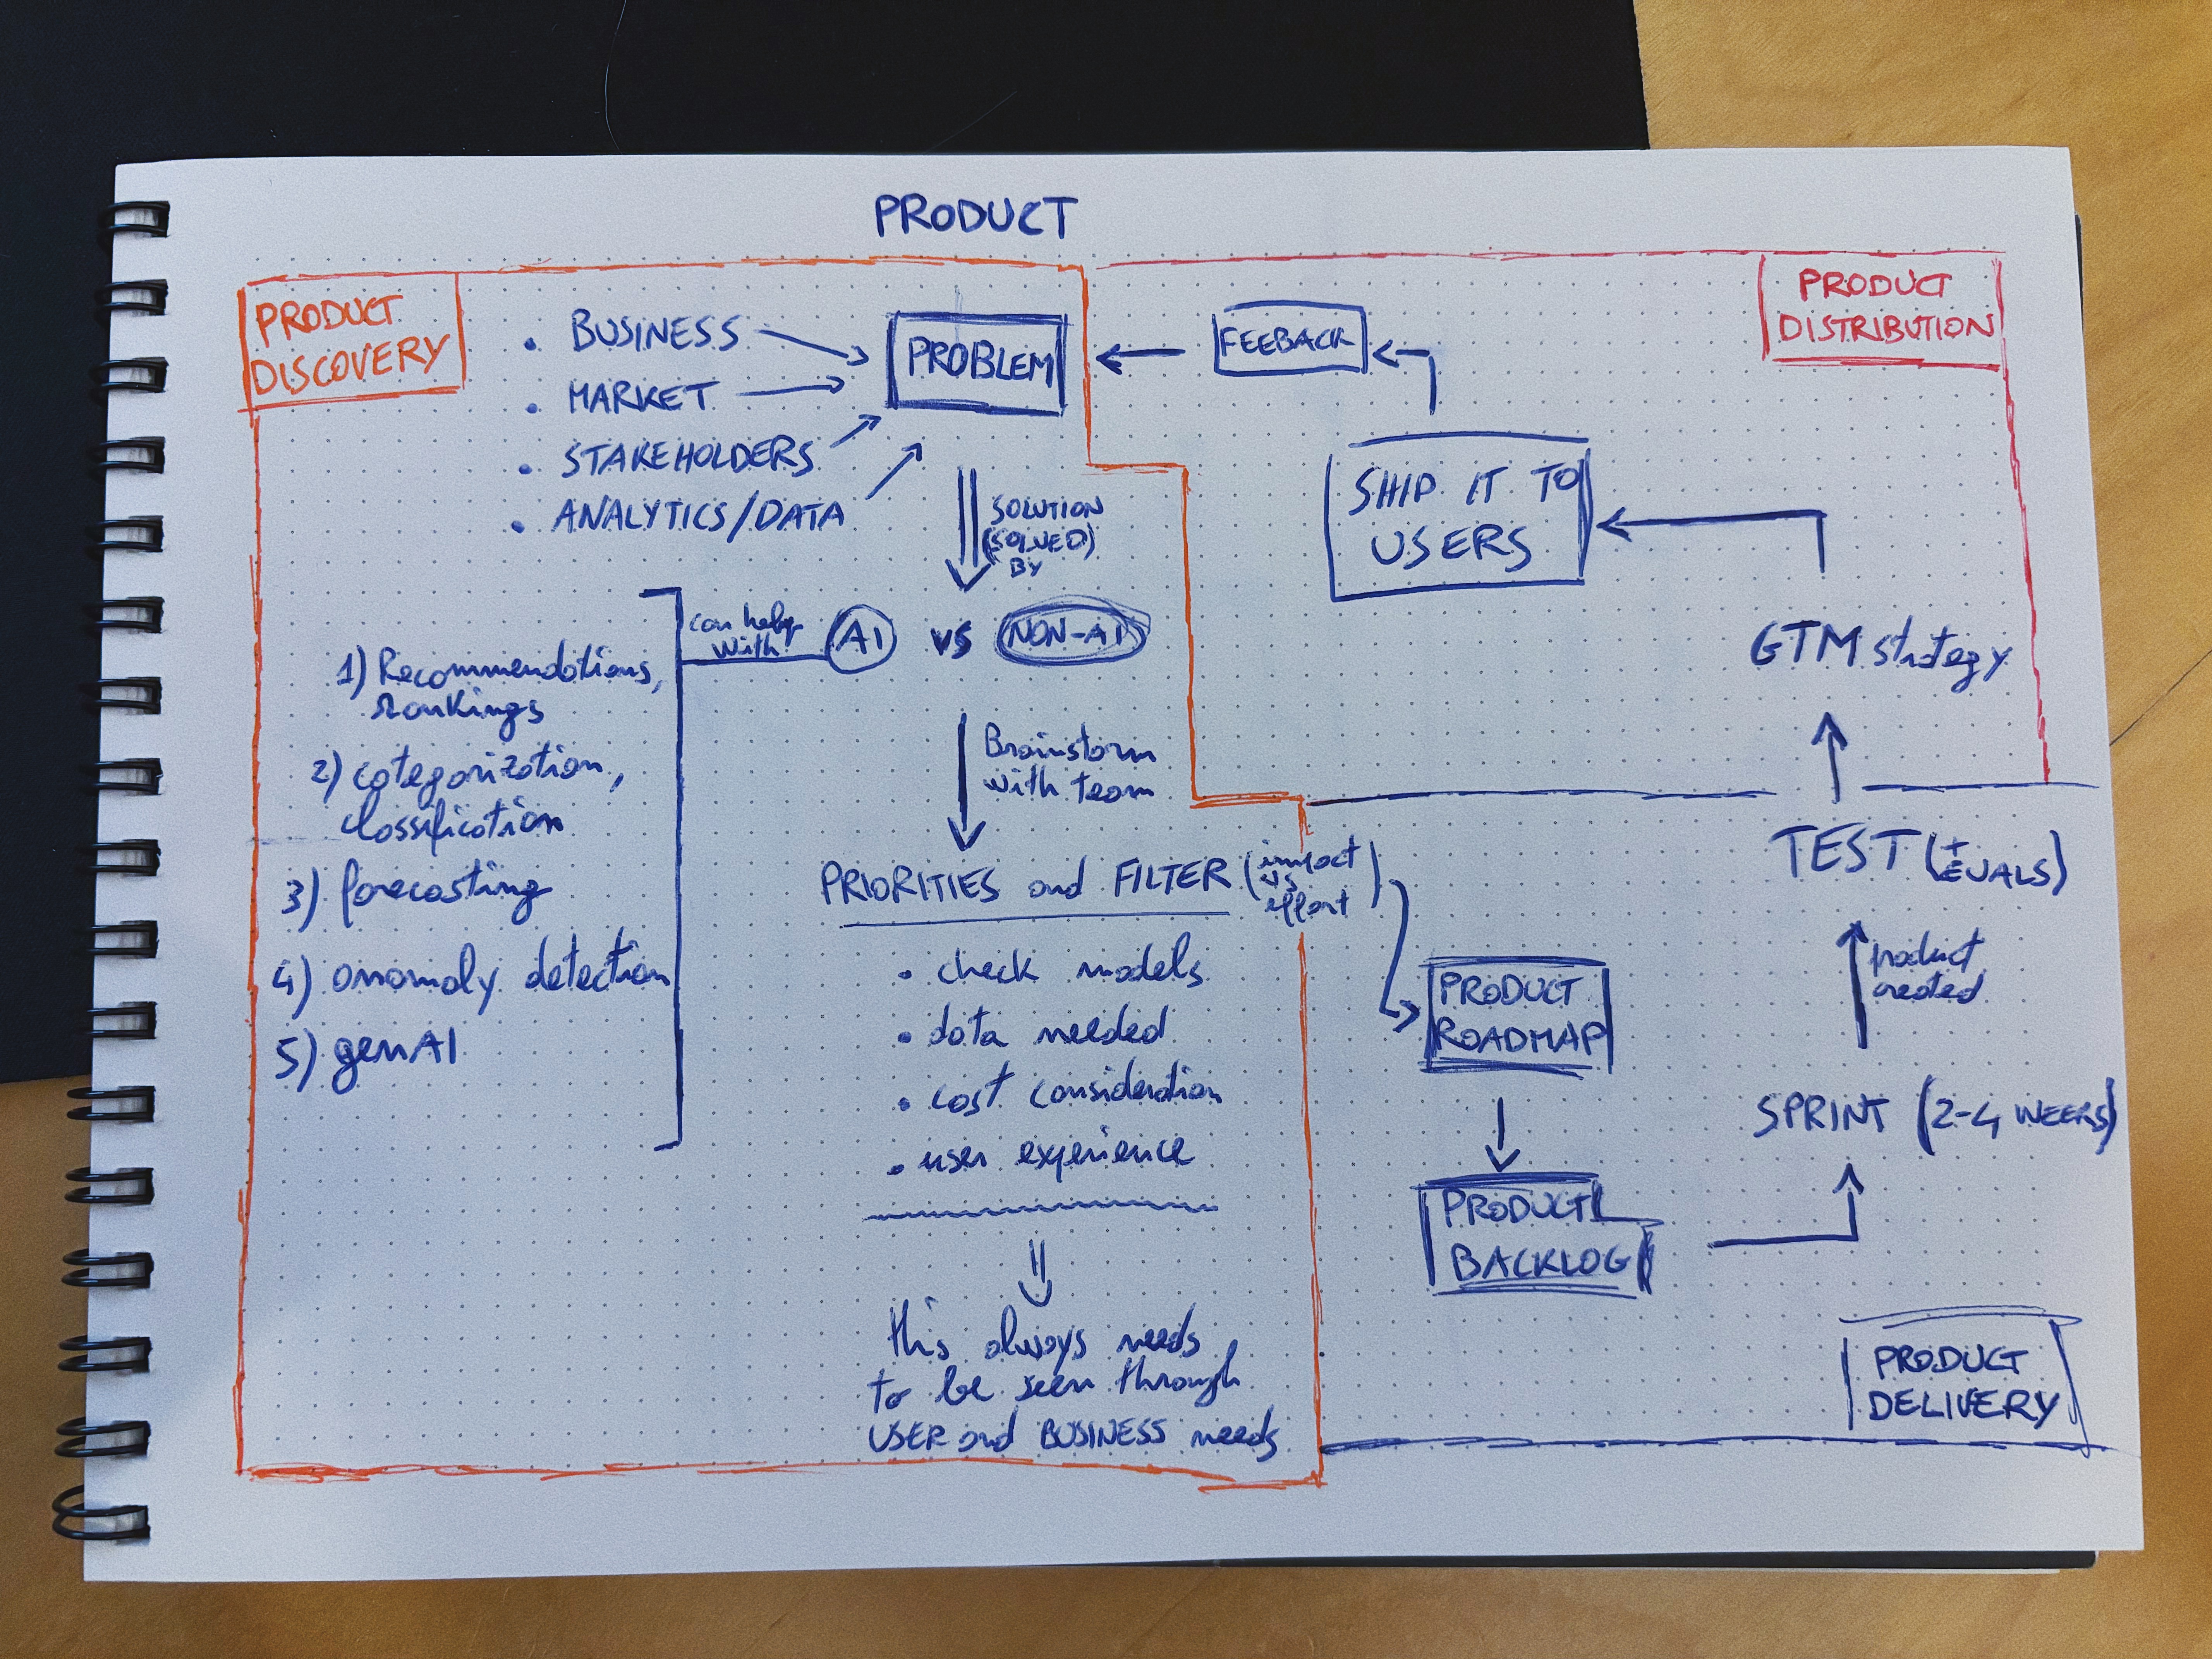
This is the framework I use before building anything with AI. I drew it while mapping out this exact pipeline. The decisions in this case study follow it directly.
Nordic Loop's AI classification pipeline was built on a YOLO model trained on just over 2,000 photos of commercial real estate assets. For the MVP, this was sufficient: YOLO classified materials into broad categories (Seating, Flooring) and enabled a working demo ahead of pilot delivery.
As the product moved toward enterprise pilots (specifically Skanska), the accuracy bar shifted. Digital Product Passports (DPPs) are legal records under CSRD. Wrong classification data in a DPP is worse than no data. YOLO's ceiling was becoming a product risk.
YOLO had two hard constraints:
- Training data bottleneck. The model was trained on just over 2,000 images. The developer owning the model was concurrently completing a master's thesis, limiting retraining capacity. Sourcing high-quality construction material data at scale was independently difficult.
- Subcategory and composition blindness. YOLO was trained to classify broad categories only. It could identify "Seating" but not "Office Chair". Material composition (steel frame, fabric seat) was entirely outside its scope. Composition is a key input for accurate CO₂ calculations in DPPs.
Retraining alone wasn't going to close that gap, not within realistic constraints.
Before committing to the two-model architecture, I defined what "accurate enough" looked like. Confidence thresholds were set independently for both models:
- High confidence (≥75%): Output accepted as-is. DPP can be generated without manual review.
- Medium confidence (50–74%): Output flagged as provisional. User is shown the result with a prompt to review before confirming.
- Low confidence (<50%): Output flagged as unreliable. User is required to manually correct before the scan result is accepted.
A combined confidence score is calculated from YOLO and Gemini outputs together. The 75% threshold was chosen as the minimum bar for legal-grade output: the level at which classification errors would be rare enough not to materially undermine DPP reliability in an enterprise audit context.
I evaluated multimodal models using the MMMU Pro Benchmark leaderboard. Gemini Flash wasn't the top performer overall (Gemini Pro ranked higher) but it was among the strongest available. The decision to use Flash over Pro came down to cost and ease of implementation. Nordic Loop already had a Google account, so API access was straightforward. I treated the model selection as replaceable. The architecture supports upgrading if accuracy requirements change.
I wrote a PRD scoping the two-model architecture and worked with engineering to define the role of each model:
| Model | Role |
|---|---|
| YOLO | Bounding box detection, category and subcategory |
| Gemini | Material composition and condition |
Key PRD decisions:
- Scope Gemini to classification and composition only: no quantity inference, no CO₂ calculation
- Define integration contract between YOLO output and Gemini input
- Assign implementation to Rimo, who had the most capacity at the time
- Stage rollout as internal beta before production deployment
Accepted: higher latency, higher system complexity, increased dependency on a single part-time implementer.
Latency was the tradeoff that nearly killed the design. The first implementation used Gemini 3.0 Flash and came back at 16 seconds per scan, which is unusable when someone is standing in a building holding a phone. Dropping to Gemini 2.5 Flash made the architecture viable. It survived because the model slot was deliberately swappable, which was the whole point of treating model choice as replaceable.
Measured in production across 75 scans, it now runs at 2.7 to 5.7 seconds for the typical scan, with a mean of 4.7. Three scans came back between 28 and 33 seconds. Those three are 4% of all scans and they pull the mean up by a full second on their own, which is the reason I do not report the mean as the headline: it describes a scan almost nobody experiences. The number that matters to a user is the range, and the number that matters to the roadmap is that roughly one scan in twenty five hangs long enough to look broken.
In exchange for: subcategory precision, material composition detection, and better CO₂ calculation accuracy. Without waiting for a full YOLO retraining cycle.
Mitigation steps taken:
- Scope control: Gemini's role was deliberately restricted to classification and composition only. Narrowing the scope limits the surface area for failure.
- Phased rollout: Internal beta before production deployment. Real-world testing on a controlled sample before the pipeline handles live pilot data.
- Lean implementation: The developer actively trimmed the project to keep it minimal and maintainable.
- Manual material tagging reduced from ~2 minutes to under 30 seconds per item. The two-model output replaced the manual classification step that had previously required human review for every scan. This one is my own timing of the listing flow before and after, not instrumented analytics.
- Material composition detection now possible: a capability YOLO alone could never provide.
- CO₂ calculation precision improved. YOLO alone produced Tier 3 estimates, sufficient for ballpark figures but not audit-grade. With Gemini providing material composition data, the output moves to Tier 2 for most items. That's the realistic ceiling, and it's a meaningful step up for DPP reliability.
- Subcategory identification (e.g. "Office Chair" vs. "Seating") now available.
- Pipeline shipped and running behind the live product. In July 2026 I put it through a structured evaluation, below.
I set a 75% confidence bar in the PRD before anything was built. Months later I went back and measured whether the shipped pipeline cleared it, because a threshold nobody checks is decoration.
I built an evaluation set of 107 photos of real listings, labelled each one with the category and subcategory a user would expect, and recorded the capture conditions of every photo: angle, distance, lighting, occlusion, clutter, image quality, and whether the object was shown in a room or in isolation. Then I ran all 107 through the live scan flow and recorded what came back. 104 returned a result.
| Measure | Result | What it covers |
|---|---|---|
| Category correct | 71% | Seating, Storage, Flooring and so on |
| Subcategory correct | 50% | The field the DPP actually consumes |
| Right category, wrong subcategory | 22 of 104 | The gap between those two numbers |
That gap is the finding. A model report saying 71% and a product report saying 50% describe the same pipeline on the same photos. The first measures the model. The second measures the thing a Digital Product Passport is legally built on. Reporting only the first would have made the pipeline look close to the bar it was in fact nowhere near.
The failure is concentrated by material class, not by photo quality. Seating scored 100% and Storage 91%. Flooring scored 38%, Doors 50%, Ceiling 50%. The pipeline is good at furniture and weak at building fabric, which is the half of the taxonomy that matters most for renovation and demolition projects.
The slow scans and the wrong scans turned out to be the same scans. When I lined the latency data up against the evaluation set, the three slowest scans in production, all of them between 28 and 33 seconds, were all Flooring, and all three were classified wrong. Two were the same trap: flooring photographed lying on a floor of the same material, where the product and the background are indistinguishable. Three cases is a lead rather than a conclusion, but it changes what the fix is. "Investigate the 30 second outliers" reads as an infrastructure ticket. If the pipeline is slowest precisely where it is least certain, then fixing the weakest class fixes the latency tail too, and that is model work rather than queue work.
The hypothesis I went in with was wrong. The team's working theory was that the model needed surrounding room context to classify correctly, so I built the set to test it: 73 photos with a visible room, 31 of the object in isolation. It came out 74% against 65%. On that sample size the difference is not a finding, and the theory did not survive contact with the data. Two conditions did move the number: photos taken in dim light scored 25%, and photos taken too close to the object scored 47%. Both are user capture behaviour, fixable with a hint in the scan screen, not with model retraining.
Some of the errors were the taxonomy's fault, not the model's. The same subcategory confusions repeated: Filing Cabinets read as Shelving Units twice, Privacy Screens as Room Dividers twice, Hardwood as Laminate twice. Those are distinctions a careful human would also argue about from a single photo. Part of that 50% is a taxonomy asking for a call the photo cannot support, which is a product decision to make in the category tree rather than a defect to hand to an ML engineer.
The set, the labels and the slice breakdown went to the ML engineer as the input for the next training cycle, along with the note that improving the headline number without improving Flooring and Doors would be optimising the wrong thing.
Limits of this evaluation, stated up front: 107 photos is enough to rank classes and rule out a hypothesis, not enough to trust any slice below roughly ten. The photos are marketplace listing images rather than photos taken by real users in buildings, so the capture condition results indicate rather than prove. And I wrote the expected labels and judged the results myself, so this is one rater with no blind control.
Single-model pipeline limited to broad category classification. No material composition. DPP output required manual enrichment for every item.
Two-model pipeline with defined separation of concerns. Gemini handles intelligence; YOLO handles localisation. Composition and subcategory data flows directly into DPP generation.
The best architecture is rarely "use one tool for everything." YOLO isn't weak. It's precisely built for detection. Gemini isn't a replacement. It's a different kind of intelligence. The PM job was to understand the boundary between them and scope accordingly.
In a small team, complexity is a real cost. Every integration added is a future maintenance burden spread across fewer people. That needs to be explicit in the PRD, not something you figure out later.
Accuracy matters more in B2B than B2C, especially when the output feeds into a legal document. The tolerance for "good enough" is lower. The cost of getting it wrong is higher.
The lesson I did not expect came from measuring my own work. I wrote a 75% threshold into the PRD and it sat there unexamined for months, because setting a number feels like rigour and nobody notices that checking it is a separate job. When I finally built the evaluation set, the theory the team had been working from turned out not to hold, and the metric everyone would have reported was measuring the model rather than the product. Deciding what to count is the part of this job that is actually hard.